See Developer Tools in action
Here's the demo for checking a page's performance by using Developer Tools on Chrome or Internet Explorer browser.
Guide on checking a page's load performance
STEP-BY-STEP
-
1Open your browser
-
2Load the page you want to check.
-
3Click the F12 button on PC, and other platforms:
-
Chrome:

- "More Tools" > "Developer Tools"
-
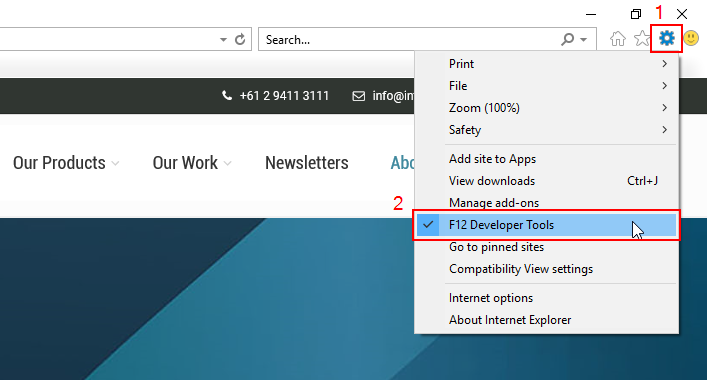
Internet Explorer:

- "F12 Developer Tools" on the dropdown.
Google Chrome Internet Explorer 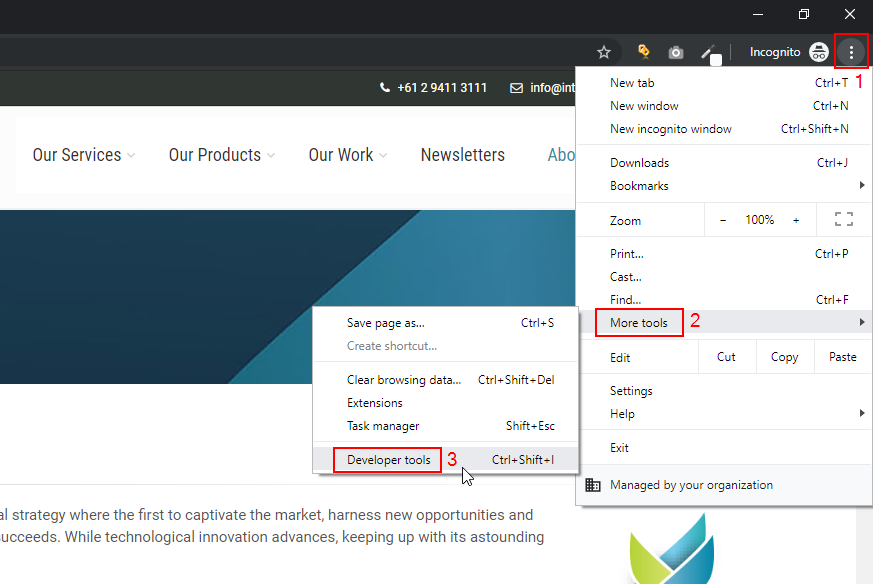
-
-
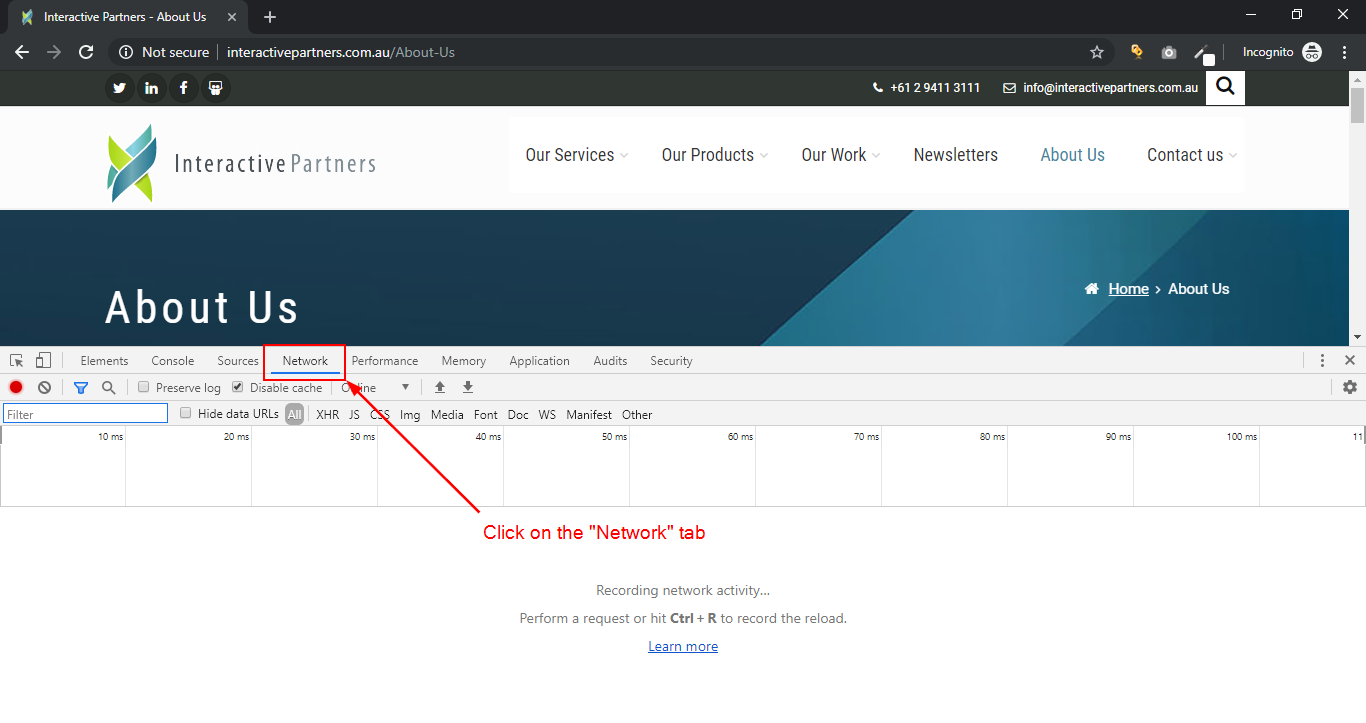
4A window like this will open at the bottom (or on the side of the browser).
-
5Click on the "Network" tab.
-
6Reload the page and watch for the results.
-
7Once the page has been completed, you can see the waterfall results showing the
-
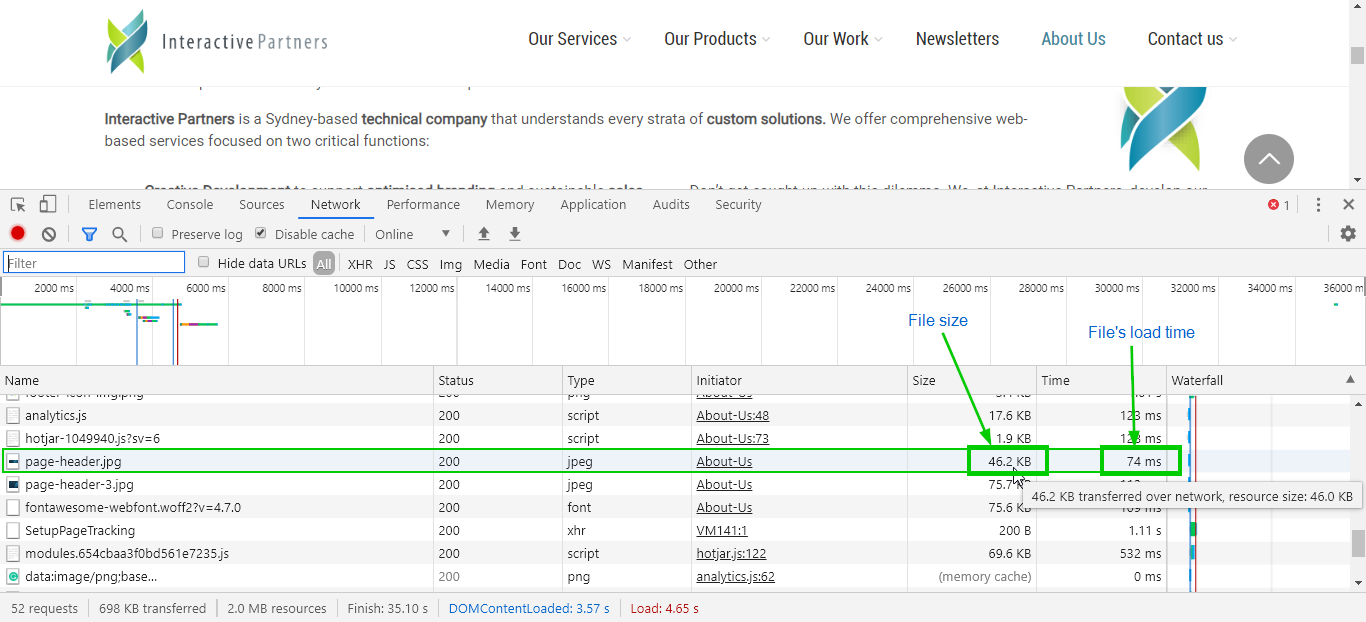
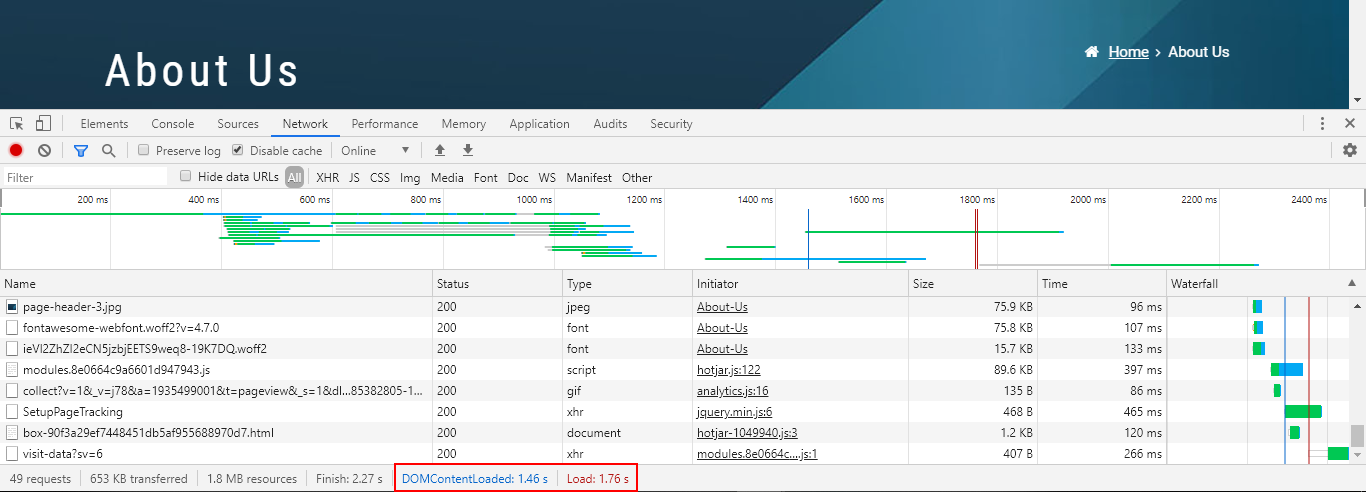
8At the bottom of the pane are the two important records for optimisation, "Load" and "DOMContentLoaded".
-
Load - this event is the time to load the page, including all of the JavaScript, CSS, and image files that are in the original HTML document. This event generally takes longer than the DOMContentLoaded event.
-
DOMContentLoaded - this event represents the perceived time by a user to load the page. It is time to render the page as described in the original document before JavaScript requests additional resources. This time is stored when the browser fires the DOMContentLoaded event in JavaScript. (An example of a resource that is requested outside of the DOM is Google Analytics.)
-
-
9Additionally, you can check each file's size and load time on the page.
- Generally, files like images have a huge impact on the page load, this is why images should be optimised.
-
10Under "Name", you will find the filenames of each file, on the same row, the file size is displayed under "Size", and the load time is under "Time".
