- Webpage Load Performance Overview
- Introduction to Webpage Load Performance
- Why you need to check your website's page load performance?
- How to check a page's load performance - Tip! don't use Google PageSpeed Insights
- How to measure your website speed?
- How to use your browser's Developer Tools to check a page's load performance?
Webpage Load Performance
Webpage Load Performance Overview
This is a documentation of ways you can check your website's loading speed.
Introduction to Webpage Load Performance
Page speed is mostly controlled by the content. For example, you may have a lightly loaded "Contact us" page that has little content loading in under 1 second. On the same site, a page full of large videos or images may take 10 seconds to load. The page size will determine load speed generally.
For basic websites, a loading time of under 3 seconds is our aim. But automotive sites tend to have lots of content and images, so we try to get the sites loading in under 4s, which makes it considered good for an automotive site. This is because some dealers use very large images which then means we miss the target time. Content is the limiting factor.
File Size
The file size checks for how many pixels the image contains in bytes. For example, an image of 2,340,000 pixels has a file size of 2,340,000 bytes or about 2.34 MB (this is because there are 1024 bytes in a kilobyte and 1024 kilobytes in an MB).
The recommended file size of images is less than 100 kilobytes for a fairly small image, and within 200 kilobytes for banners and large images.
Why you need to check your website's page load performance?
- The loading speed of your website affects your user experience, no one wants to wait for a slow-loading page.
- Visitors will wait no more than 3-5 seconds for the web page content to appear before abandoning a site.
- Recent stats show a half a second difference in page load time can make a 10% difference in sales for an online retailer.
How to check a page's load performance - Tip! don't use Google PageSpeed Insights
You might have read several articles telling you to use Google's PageSpeed Insights to measure your website's performance, here's why it is bad advice:
- PageSpeed Insights does not measure the loading time of your pages.
- The PageSpeed grade you get on the result is not an indicator of page speed. It is a score based on some fixed assumptions.
- For example, it ignores the lazy loading of images which is a known technique to improve the visitor experience.
- In PageSpeed Insights, no website ever gets a perfect grade, so it is impossible to get 100. This means you are targeting between 0 and 80, not 100 as it appears to suggest.
- The score on Page Insights does not correlate to loading speed.
How to measure your website speed?
So given the above cons of PageSpeed Insights, what should I use to accurately measure my website's load performance?
The answer is your browser's Developer Tools.
- Developer Tools is accurate, easy and free.
- It is a true measurement of a page's loading time.
- You can measure the page's load time perceived by your users and the loading time once all Javascript, CSS and files have been loaded.
How to use your browser's Developer Tools to check a page's load performance?
See Developer Tools in action
Here's the demo for checking a page's performance by using Developer Tools on Chrome or Internet Explorer browser.
Guide on checking a page's load performance
-
1Open your browser
-
2Load the page you want to check.
-
3Click the F12 button on PC, and other platforms:
-
Chrome:

- "More Tools" > "Developer Tools"
-
Internet Explorer:

- "F12 Developer Tools" on the dropdown.
Google Chrome Internet Explorer 

-
-
4A window like this will open at the bottom (or on the side of the browser).
-
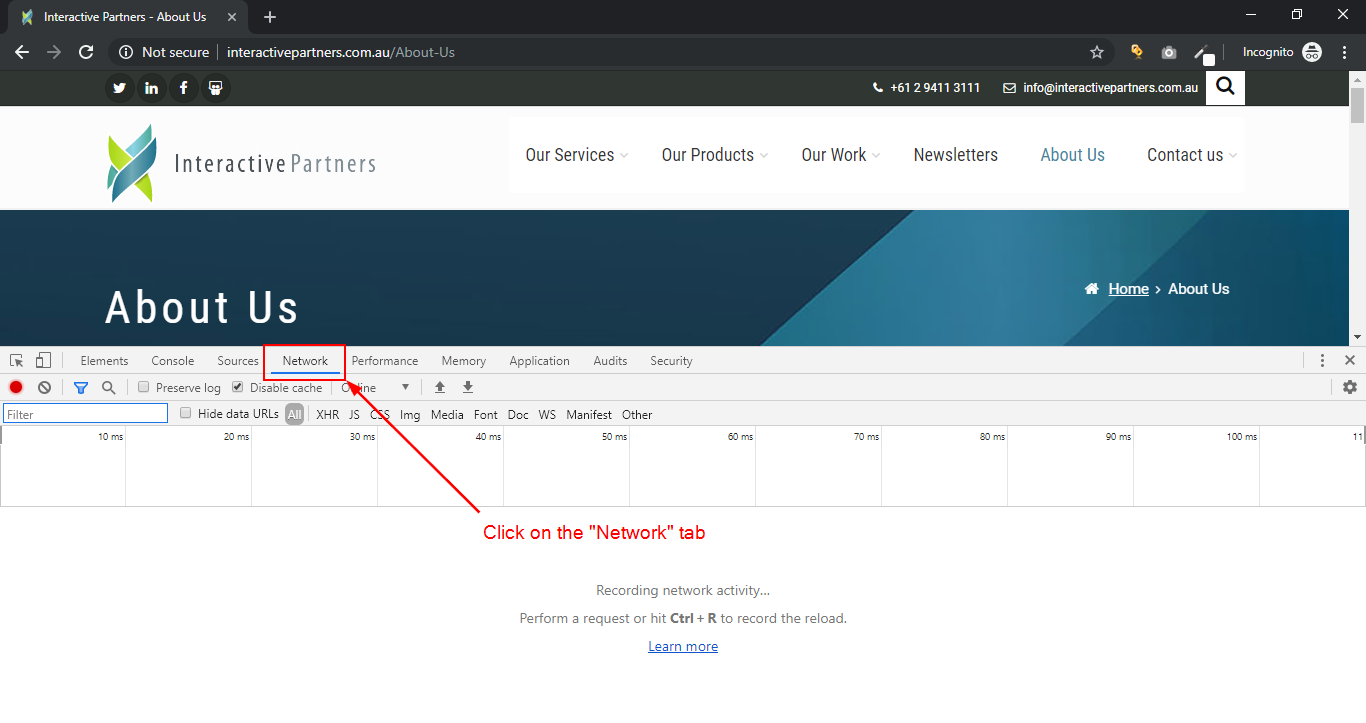
5Click on the "Network" tab.
-
6Reload the page and watch for the results.
-
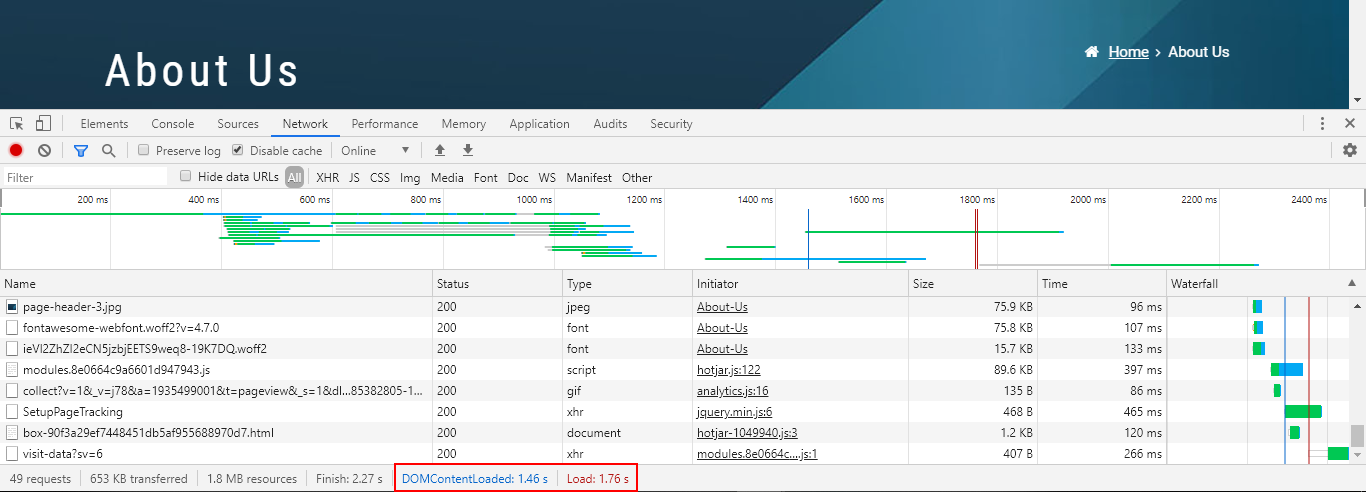
7Once the page has been completed, you can see the waterfall results showing the
-
8At the bottom of the pane are the two important records for optimisation, "Load" and "DOMContentLoaded".
-
Load - this event is the time to load the page, including all of the JavaScript, CSS, and image files that are in the original HTML document. This event generally takes longer than the DOMContentLoaded event.
-
DOMContentLoaded - this event represents the perceived time by a user to load the page. It is time to render the page as described in the original document before JavaScript requests additional resources. This time is stored when the browser fires the DOMContentLoaded event in JavaScript. (An example of a resource that is requested outside of the DOM is Google Analytics.)
-
-
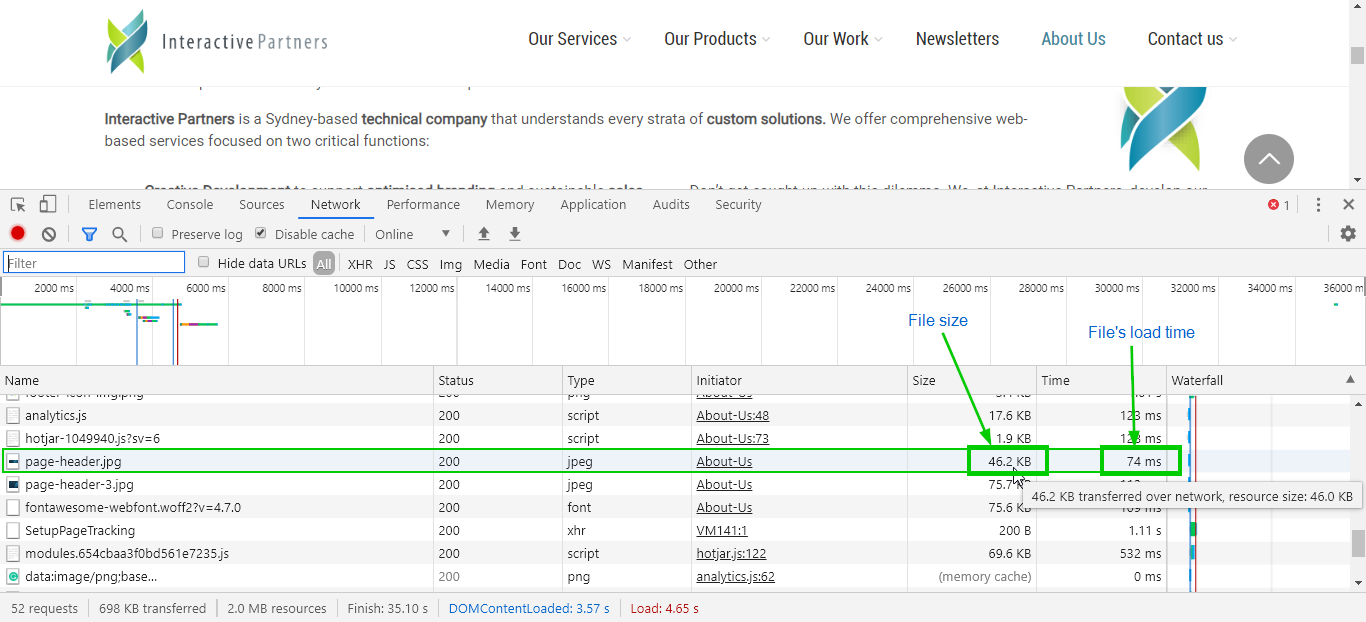
9Additionally, you can check each file's size and load time on the page.
- Generally, files like images have a huge impact on the page load, this is why images should be optimised.
-
10Under "Name", you will find the filenames of each file, on the same row, the file size is displayed under "Size", and the load time is under "Time".